


In many ways, what follows is an informal case study. Most of the 1,600+ teams that produced 51,000+ goals in the ECNL regular season are now enjoying a summer pause. For others - including 3 Northern Virginia 2010 Boys teams - the postseason awaits! Let's consume as-much data as-possible to enlighten these 3 teams' journey inside their group stages. Is what follows "excessive" from a data consumption perspective? Of course it is!
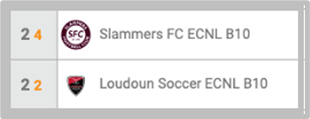
Arlington Soccer, Northern Virginia Alliance (NVA) and Virginia Development Academy (VDA) aren't just regional "giants" in the game of soccer: they also enjoy a rich history of nationwide success across multiple age groups. In the 2010/U14 Boys Age Group, all 3 teams secured a spot at this year's ECNL Playoffs in California. However, last year, in this 2010 age group, only NVA (fka Loudoun Soccer) made it into the post-season. This is how they exited their group stage in 2023:
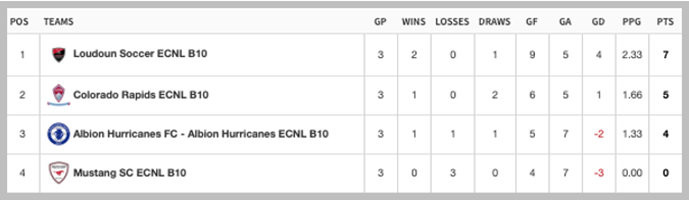
In 2023, across 2010 Boys, the 12 winning teams that exited their 4-team group-stage did so, as follows:
- 7 Teams (58%): 2 Wins; 1 Draw
- 3 Teams (25%): 3 Wins
- 2 Teams (17%): 2 Wins; 1 Loss
... and 4 of the 9 teams above - with 1 Draw or 1 Loss - required tiebreakers to move-forward into the tournament.
Interpreting Play Groups' Offensive Defensive Profile
In this year's Playoff Draw, 64 2010 Boys teams (out of 145) were sliced-into 16 groups. We consumed the average regular season GF-G and GA-G for each of these teams, in-order to visualize the weighted-effect across these groups, as follows:
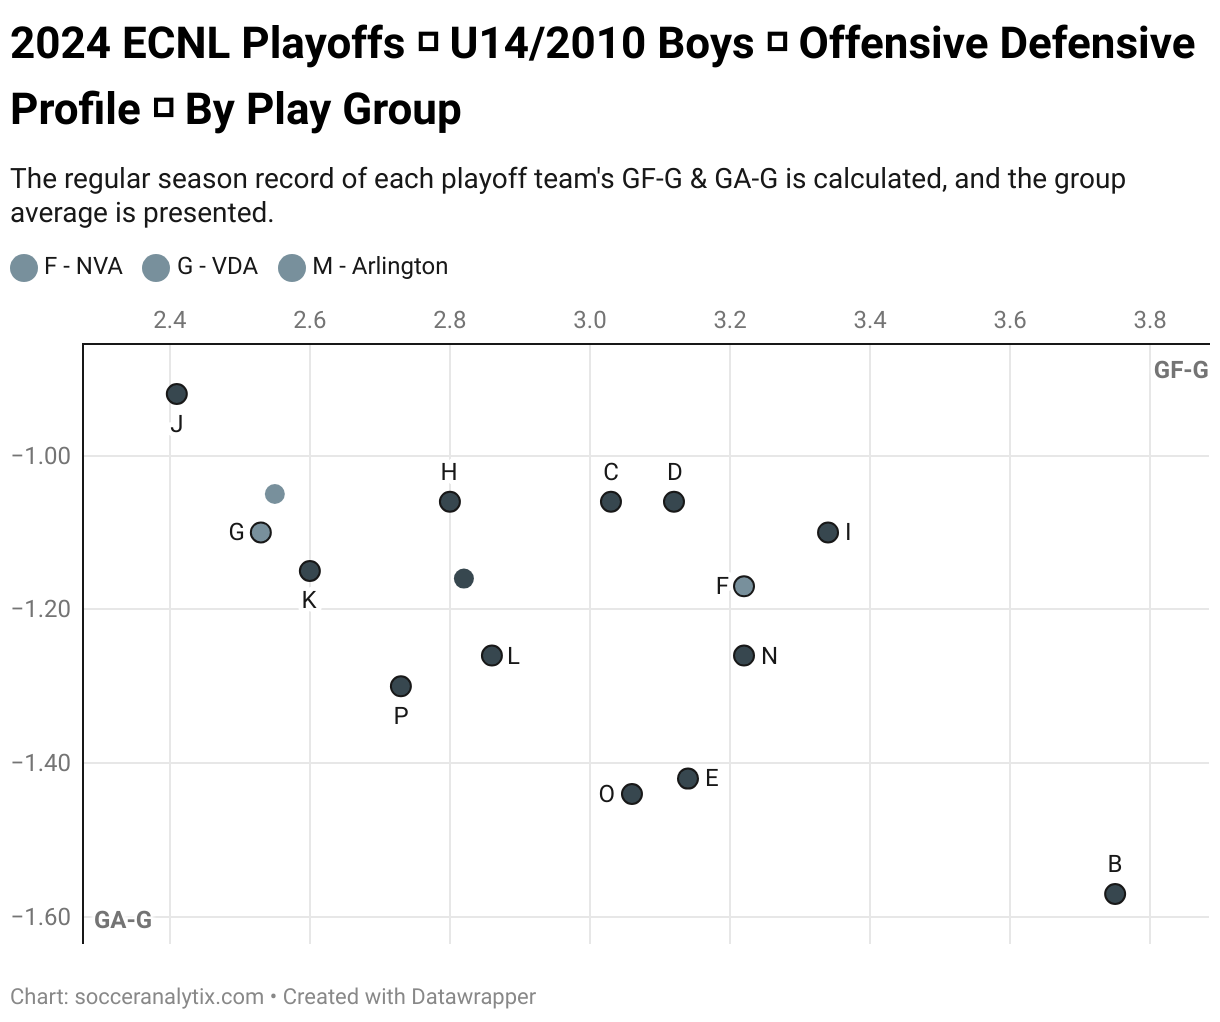
From the above, some takeaways:
- Arlington Soccer and VDA are parked-into groups with similar profiles, where teams have a recent history of winning games with relatively-smaller GD margins.
- NVA's Group F has an aggregated higher-scoring history.
- By the way, Group B is somewhat of an outlier for 2 reasons:
- It contains NCFC Youth Academy, 2nd in nationwide regular season age group rankings (ie: high GF-G).
- Supreme FC (ranked 88th) appears to have replaced its conference counterpart Florida West (ranked 64th) into the Playoffs (ie: high GA-G).
Analyzing Northern Virginia's opponents inside Play Groups
The tables below include nationwide team rankings across 4 items: PTS-G, GF-G, GA-G and GD-G. They yield insights on relative Offensive vs Defensive capabilities displayed during the regular season.
VDA - Virginia Development Academy
Group G's strongest-adversary is Santa Clara Sporting. Ranked #8 nationwide on PTS-G, it had 1 Loss in its 26 regular season games:
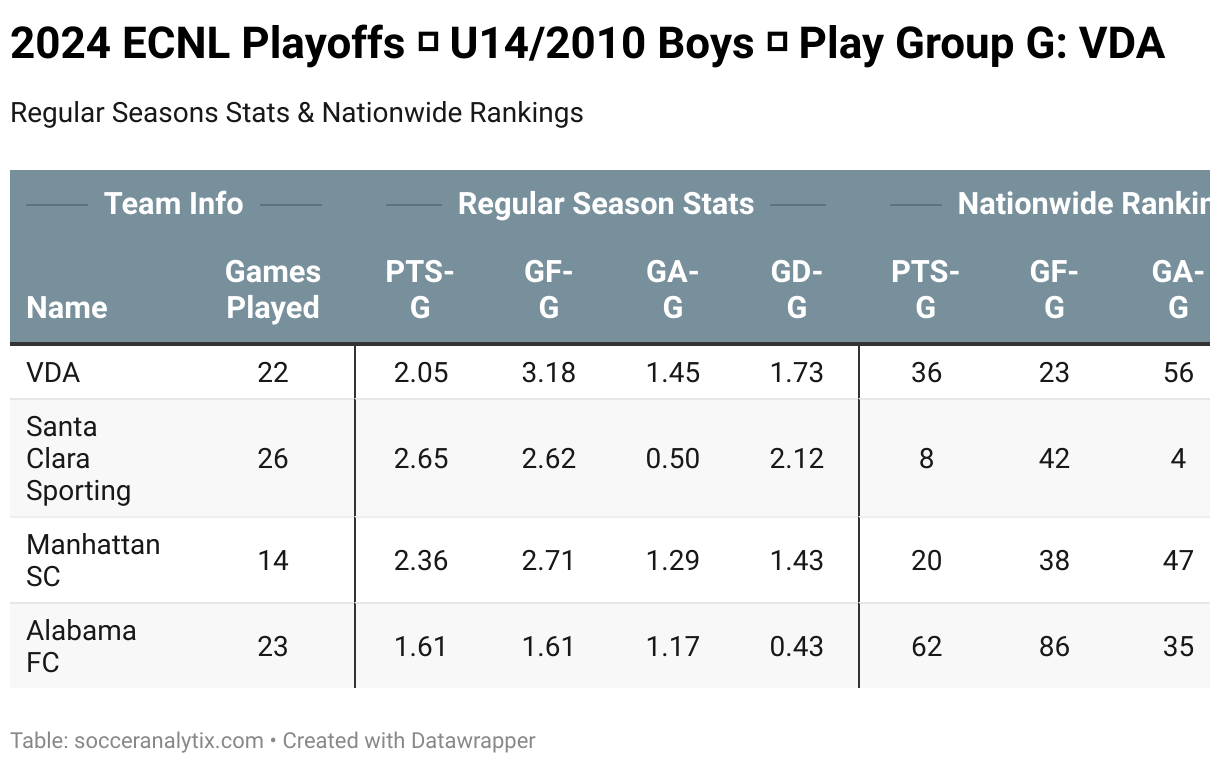
Other takeaways:
- Santa Clara Sporting's high-ranking on PTS-G is mostly-driven by its #4 ranking on GA-G. Ranked behind VDA on its offensive record (ie: #42 vs #23), they may find out "the hard way" that VDA wins games with GD of 4-or-more 36% of the time, compared to their own 23%.
- In terms relative to VDA, Manhattan SC and Alabama FC should not be under-estimated on all-things defensive.
Arlington Soccer
Group M's strongest-adversary is Northwest's XF Academy. Relative to its counterparts, their regular season data infers an ability to just "... score more and concede less".
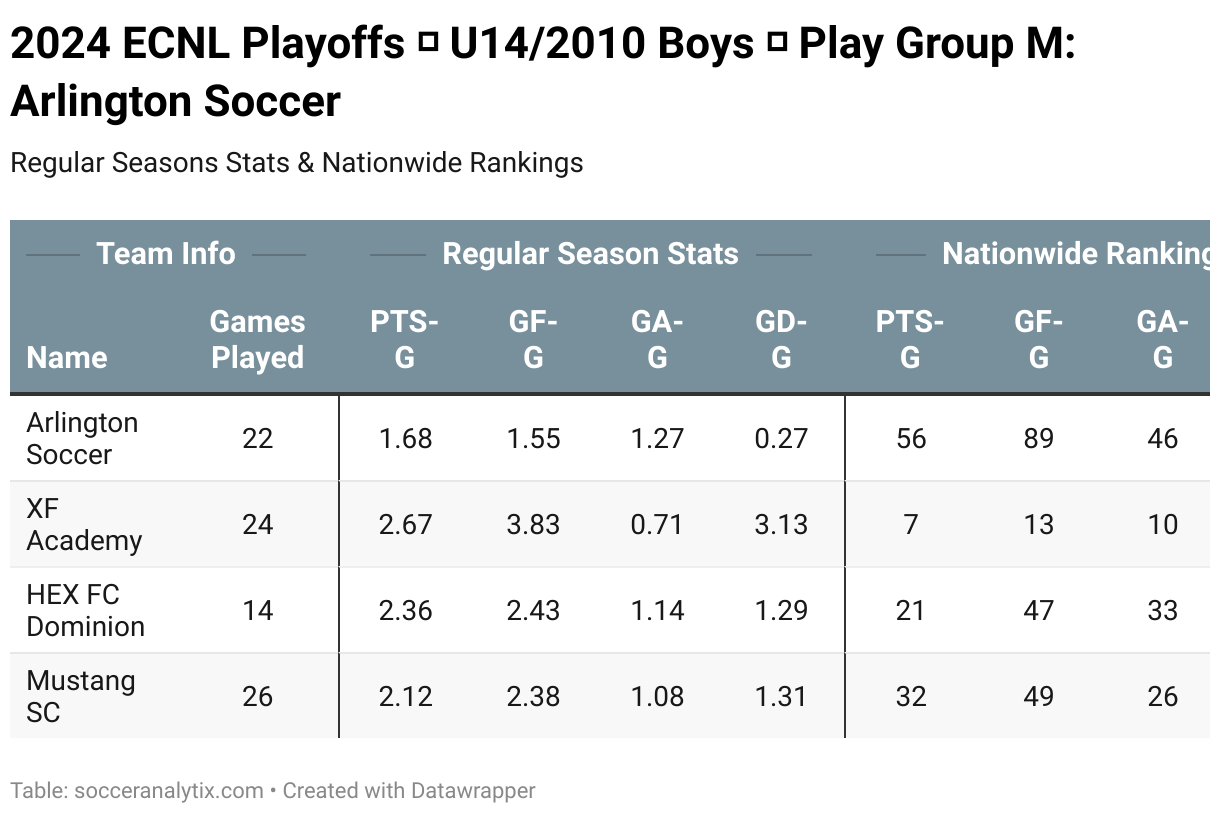
Other takeaways:
- Arlington Soccer will be perceived as an underdog in this group. However, we note that they won 32% of their regular season games by a one-goal margin... a high percentage nearly-unmatched across the entire playoff population. You can interpret this datapoint in different ways... but one of them is that Arlington Soccer has the grit-and-resilience to win low GD games.
NVA: Northern Virginia Alliance
Inside Group F, NVA's strongest-opponent is Northeast's FSA FC. Ranked nationwide among the Top 10 across all 4 metrics below, they had an outstanding regular season.
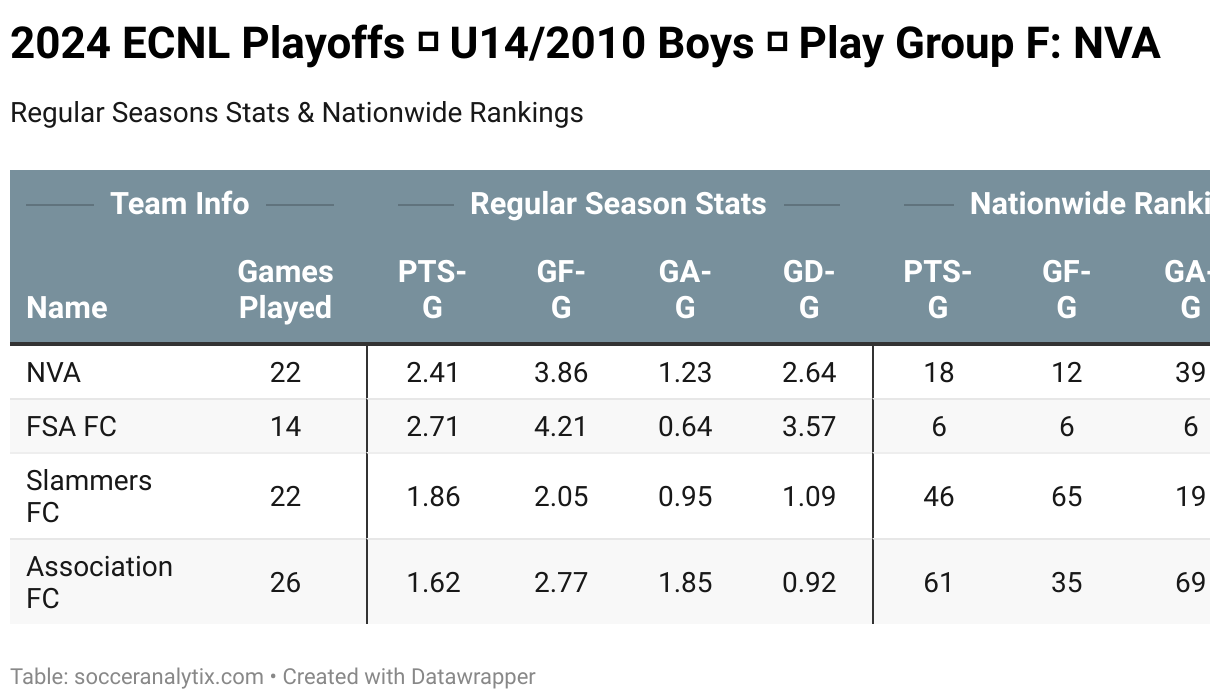
Other takeaways:
- It's relevant to highlight that, during the regular season, NVA played 57% more games than FSA FC... and won 5 more games than them.
- It's also relevant to highlight that NVA's record is stronger than FSA FC's closest-opponent in its Northeast Conference.
- The virtual hallways within Group F are "haunted" by Slammers FC... they ended NVA's journey last year... in the Final 8 Round:
What follows is just anecdotal... but is it surprising that 3 of last year's Final 8 Round teams are here in Group F (ie: FSA FC also lost that round to San Diego Surf, the eventual tournament winner)?
2024 is just like 2023: NVA's 2010 Boys have what-it-takes to win their group stage.
De-averaging results yields other insights: an NVA example
We learn "a lot" by leveraging average per-game data. At SoccerAnalytix, we also de-average datasets in-order to surface different aspects of a story. In the above Group F table, you noticed that both NVA and FSA FC delivered impressive goal-productions stats: the former's GF-G at 3.86 and the latter at 4.21. In some ways, it's hard to interpret the variance (4.21 - 3.86 = 0.35). One way is to assert that FSA FC scores 1+ goal than NVA for every 3 games.
The table below de-averages both teams' scoring cadence, and - in our opinion - highlights many similarities between them:
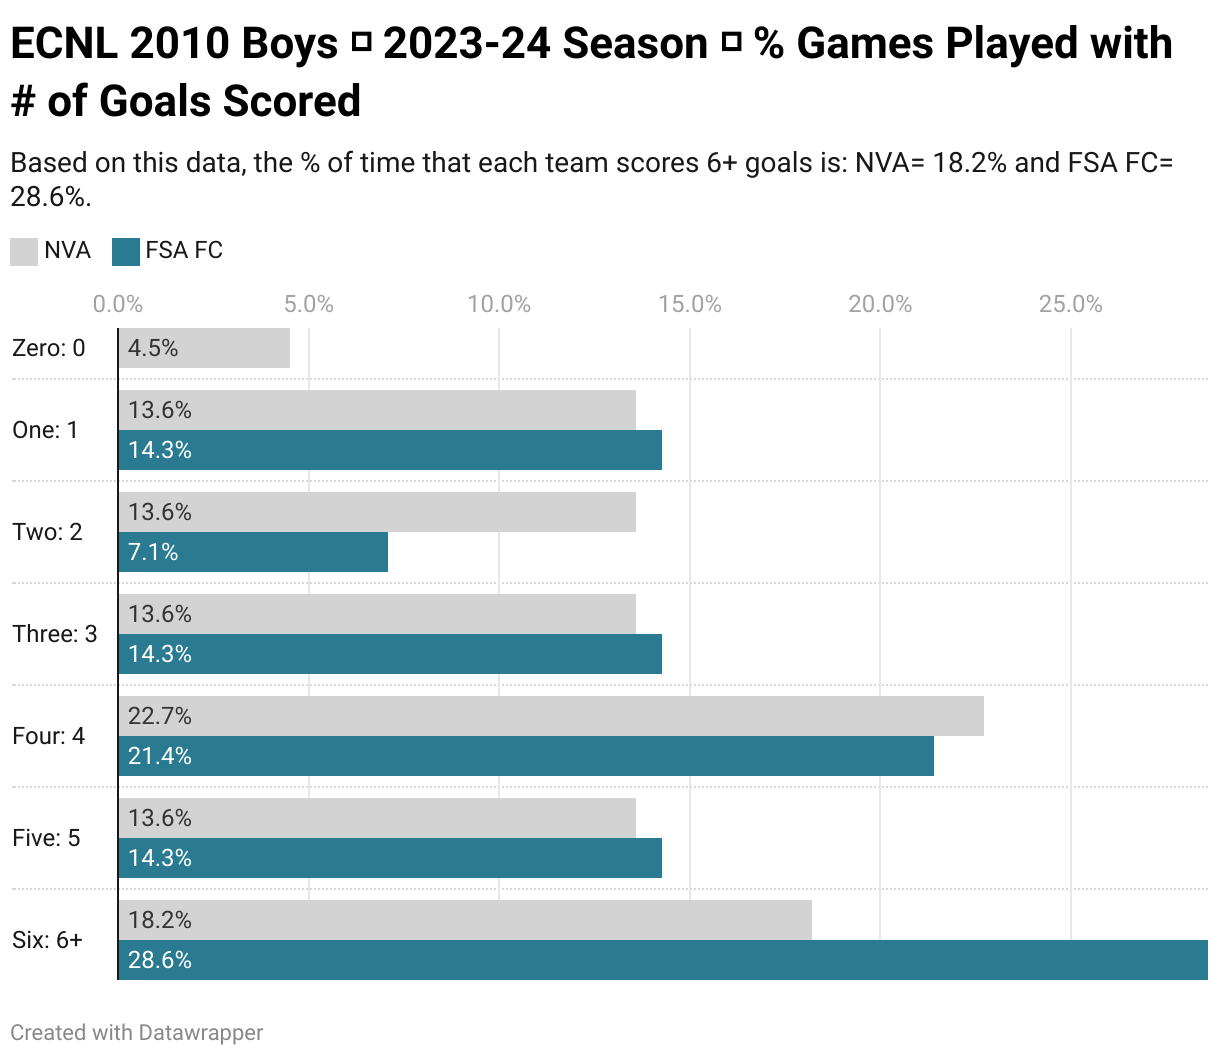
Taking a step-back, both teams absolutely stand-out by producing such a high percentage of high-scoring games. However, is FSA FC that much stronger by producing 6-or-more goals-per-game ≈10% more often than NVA? A few thoughts:
- Behind the %, note that, during the regular season, both teams produced the same count (which is 4) of games with 6-or-more goals.
- At some point, the % of high-scoring games highlights "less" about the scoring team itself, and "more" about the relative weakness of available opponents. Let's elaborate-further on this in another episode.
A quick note on implied Conference Rankings
At pro levels in many sports, different conferences - inside the same league - yield demonstrably different levels of competitiveness. This is also the case within ECNL conferences. For 2010 Boys, the strongest teams inside relatively-stronger conferences are winning with aggregate GD-G closer to 1.0, whereas their equivalents in other conferences are winning with GD-G in-excess of 2.0. In this current episode's dataset, we did not quantify inter-conference variances... but it's an aspect to consider for future analytics.
Final thoughts...
Last year, for the 2010 Boys teams that made it to the Final 8 Round - this was their regular season nationwide ranking:
- 3rd, 6th, 11th, 12th, 21st, 22nd, 25th & 35th
In other words: you never know what might happen in California!
That's it - playoff updates coming-up next week!
Richard - From SoccerAnalytix