


(Note: If using a mobile device, reading this post sideways - landscape - will improve readability of tables, data, etc.)
Through Quality-of-Opposition (QOpp) analytics - we:
- Aggregate age group teams into 3 cohorts: the Top 1/3, the Mid 1/3 and the Base 1/3 (updated weekly).
- Compare the relative performance of these cohorts against each other.
- Differentiate the strongest teams in a given conference... and compare them to the strongest teams in another.
- Integrate the concept that Attacking/Defending profiles change in-relation to quality-of-opposition.
By applying QOpp to a single team, we deliver different insights on how their Attacking/Defending profile evolves in-relation to opposition. In this example:
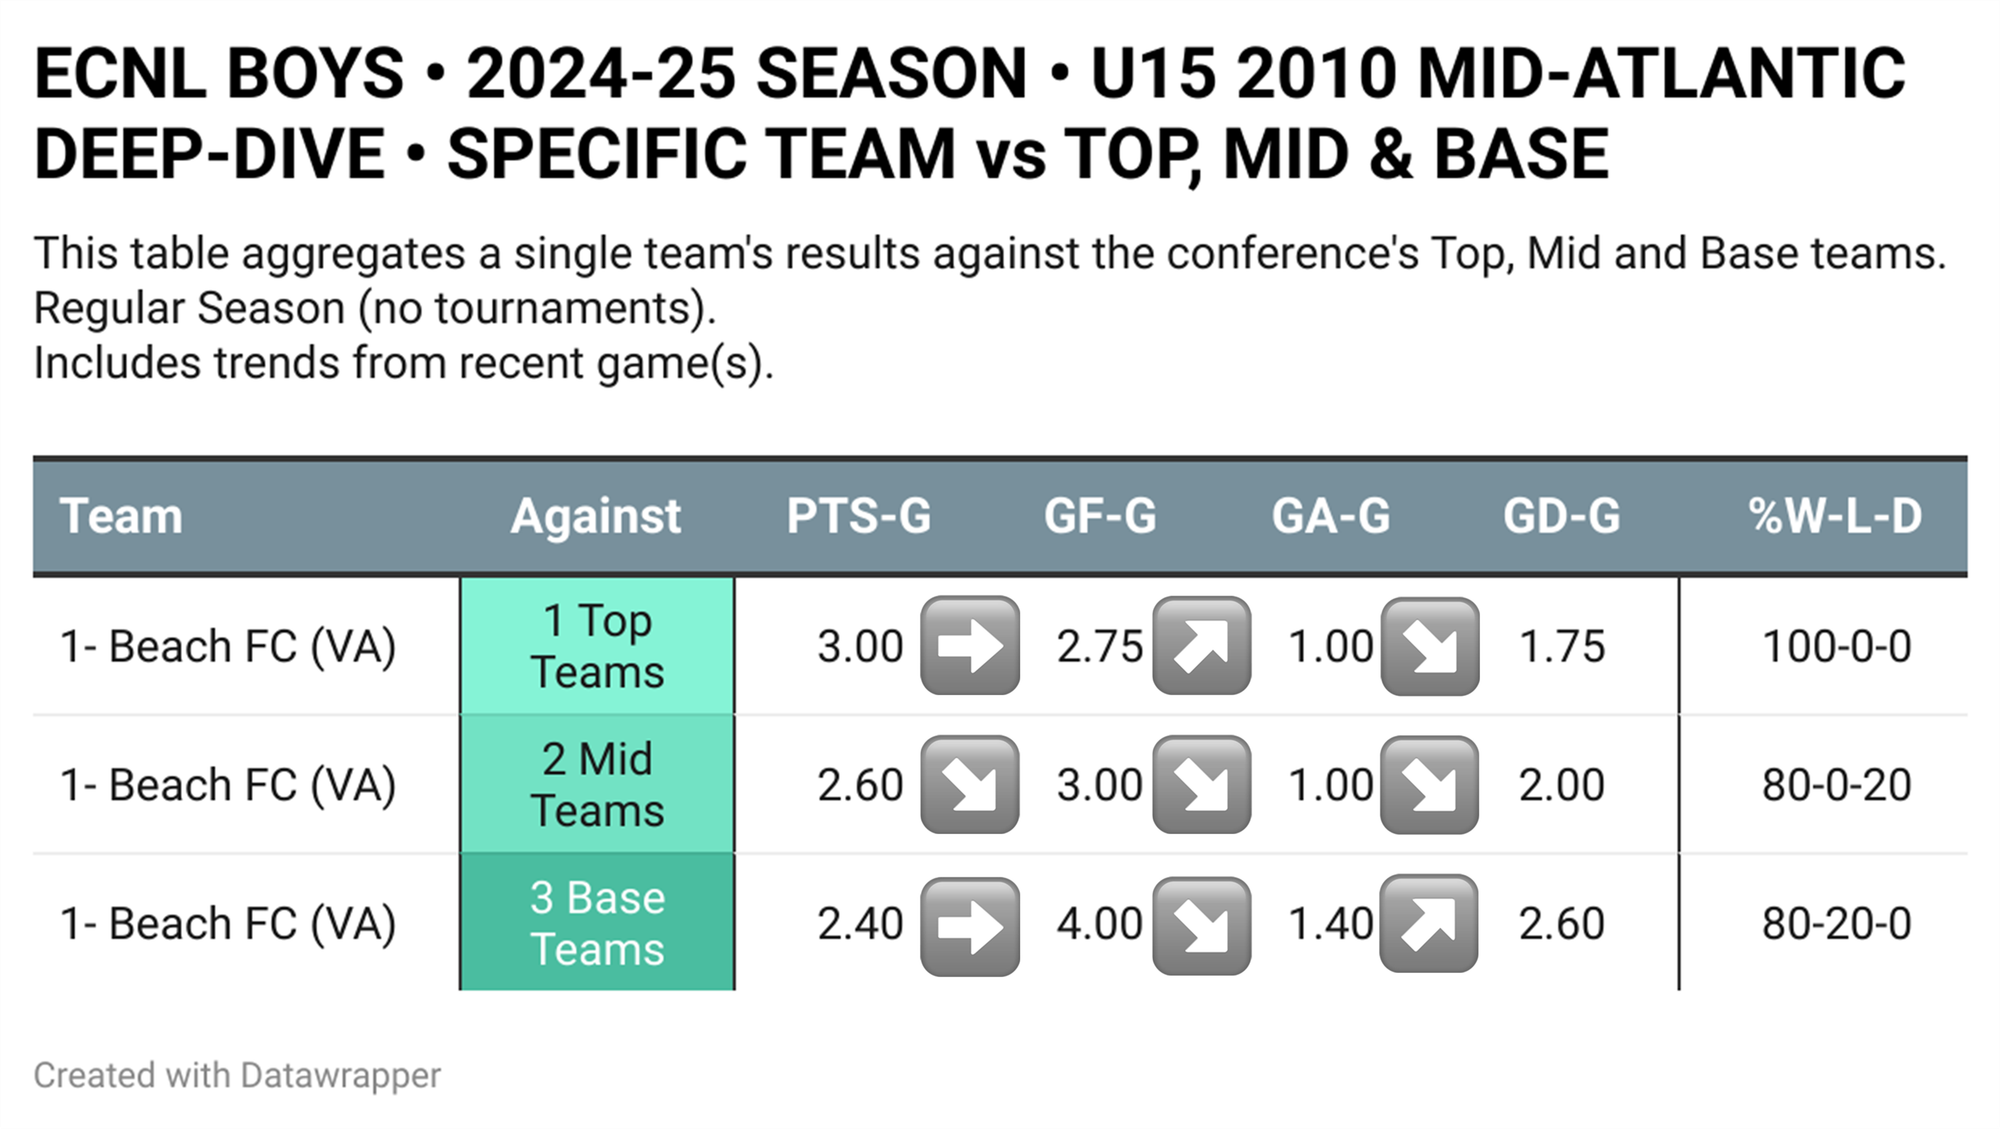
Beach FC (VA) ended its season as the #1 team in its conference. They won every single game against their top conference rivals, but - oddly - were not able to maintain that level of domination onto its weaker opponents (Base Teams).
ECNL Conference Quality-of-Opposition Benchmarking
For the 2024-25 Season, here's an initial summary of the Southwest and Mid-Atlantic U15 conferences:
A few observations:
- Compared to Southwest Top Teams, Mid-Atlantic Top Teams scored more goals against all Tiers.
- Compared to Mid-Atlantic Base Teams, Southwest Base Teams scored more goals against all Tiers.
- Inside the Southwest Conference, the GF-G variance between its Top Teams and Base Teams is 64% smaller than Mid-Atlantic. Might this reflect a more competitive-and-balanced conference?
The data above was generated by these team tiers:
Here's a visual that highlights how these tiers competed against each other:
There are many a-ha moments in this graph, but consider this:
- In the Mid-Atlantic Conference, the Top Teams lost more-often (12%) against their Base Teams... than the Mid Teams (8%). In our opinion, these datapoints provide insights into a team's resilience and competitive mindset... that make a difference in a nationwide event such as the ECNL Playoffs.
Let's go deeper into the data:
Example of a key observation:
- In the Southwest U15 Conference, 21% of games ended in a Draw, which is almost twice-as-high as Mid-Atlantic... another sign of a very-competitive conference!
Summary
Quality-of-Opposition Analytics improves our ability to interpret team - and conference - performance. It highlights different Attacking/Defending profiles against opponent strength.
We compared the 2010 U15 2024-25 Season Southwest vs Mid-Atlantic Conferences. We presented evidence supporting the thesis that - in relative terms - competitiveness inside Southwest was higher.
Richard - from SoccerAnalytix